Functionality View graphs and dashboards feature of the K inventory management application, enables you to view and analyze inventory variations quickly and easily.
1. Click on the Reports ![]()
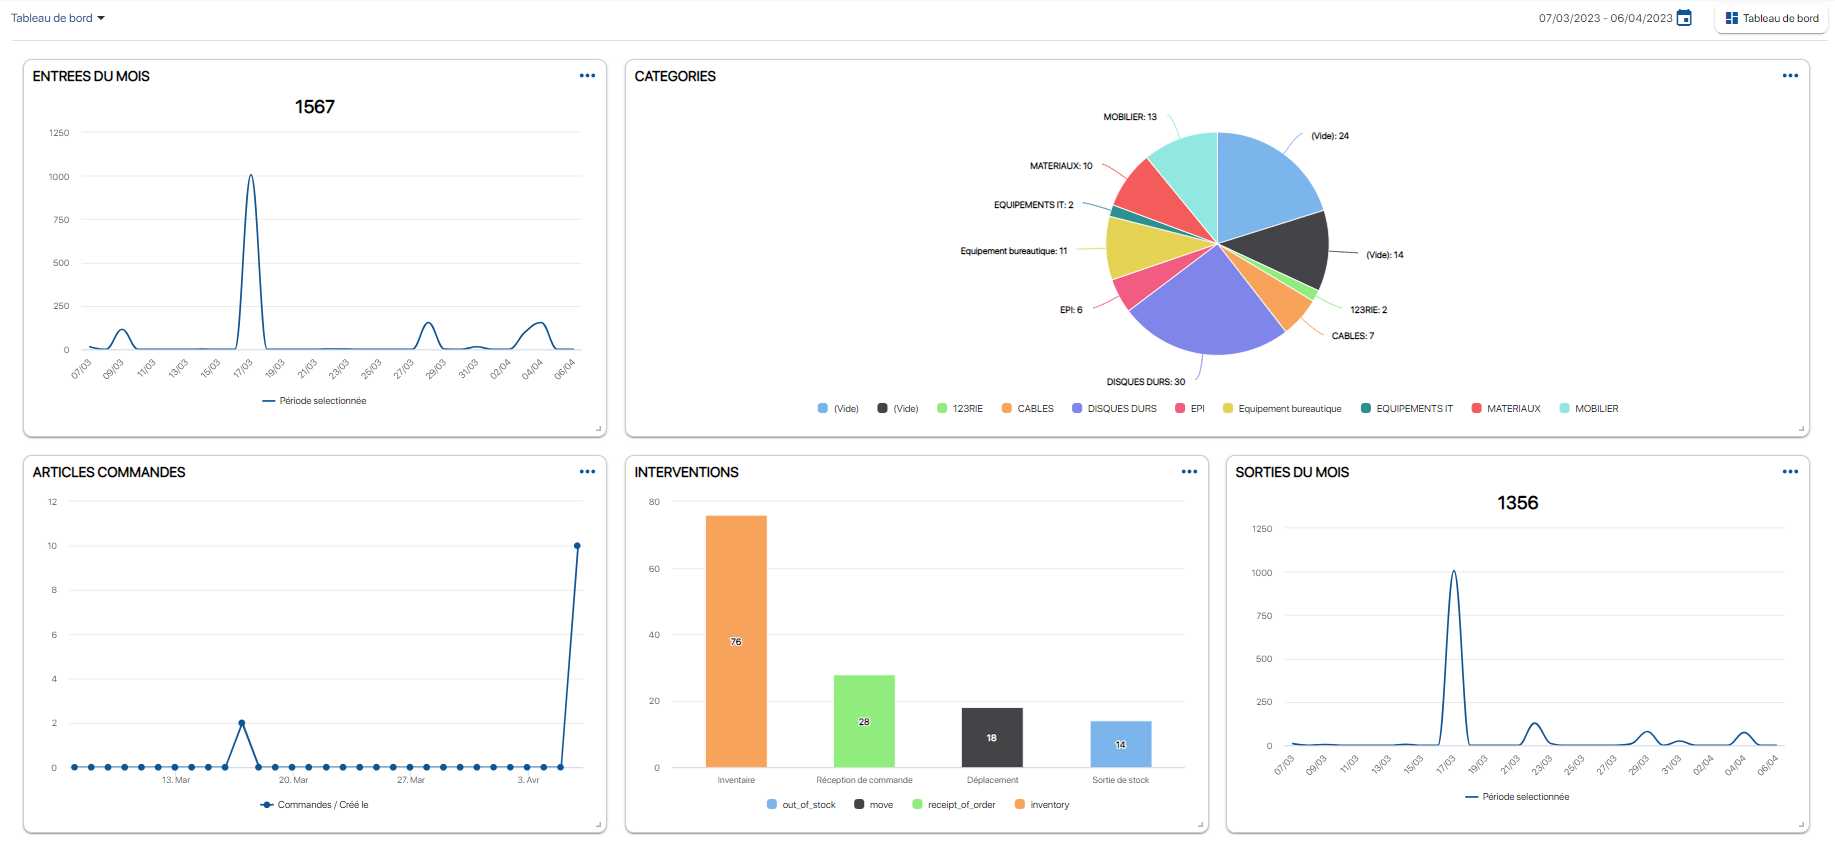
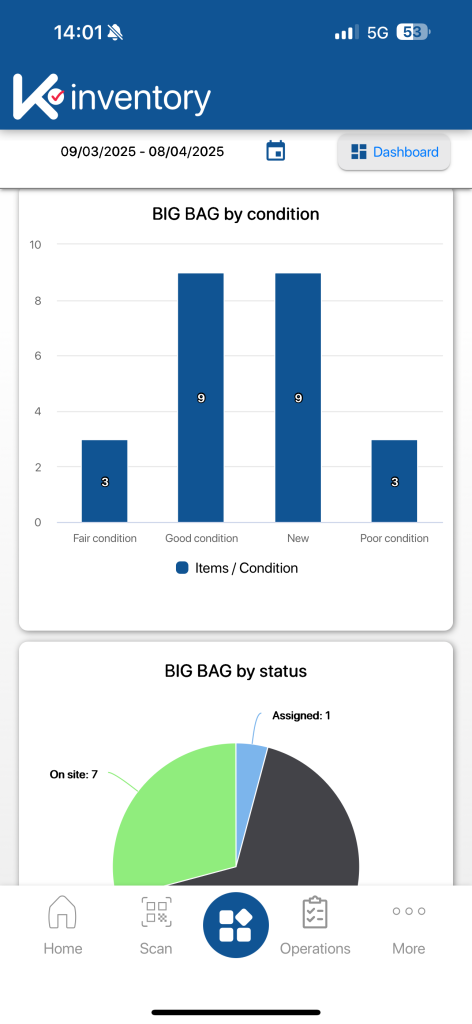
Dashboard page
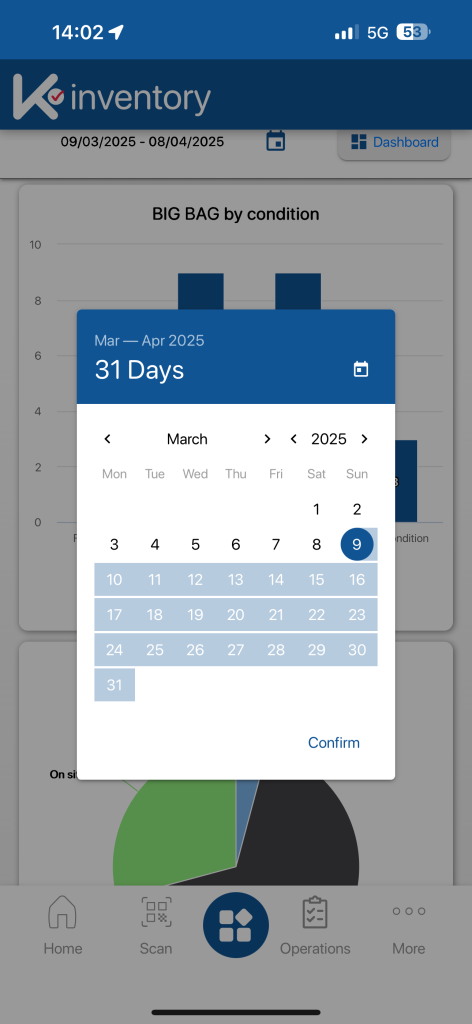
2. To change the monitoring period, click on the Calendar icon ![]() icon, then select the desired time interval
icon, then select the desired time interval
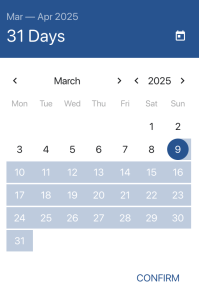
Pop-up to select monitoring period
3. To hide a graph in a dashboard, click on the icon more actions ![]() icon, then on the Hide button to hide a Dashboard
icon, then on the Hide button to hide a Dashboard
4. To download a customized graph, click on the icon more actions ![]() icon, then on the Download A copy of the graphic will be downloaded in png format.
icon, then on the Download A copy of the graphic will be downloaded in png format.
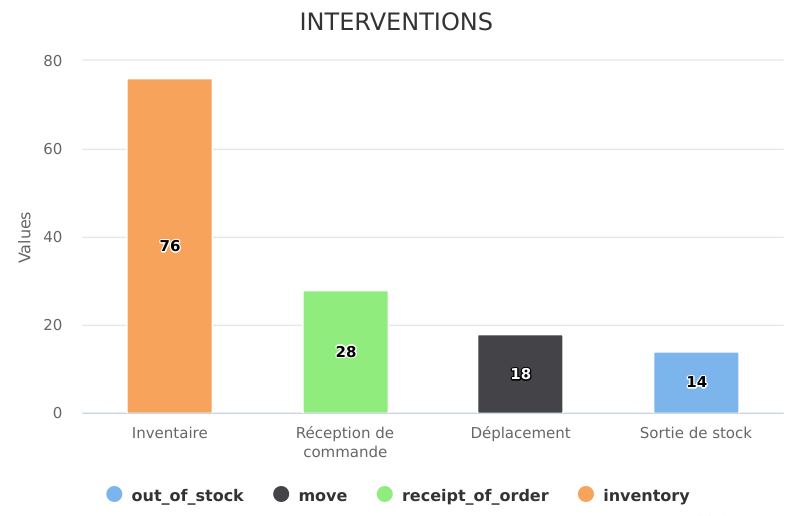
Downloaded chart
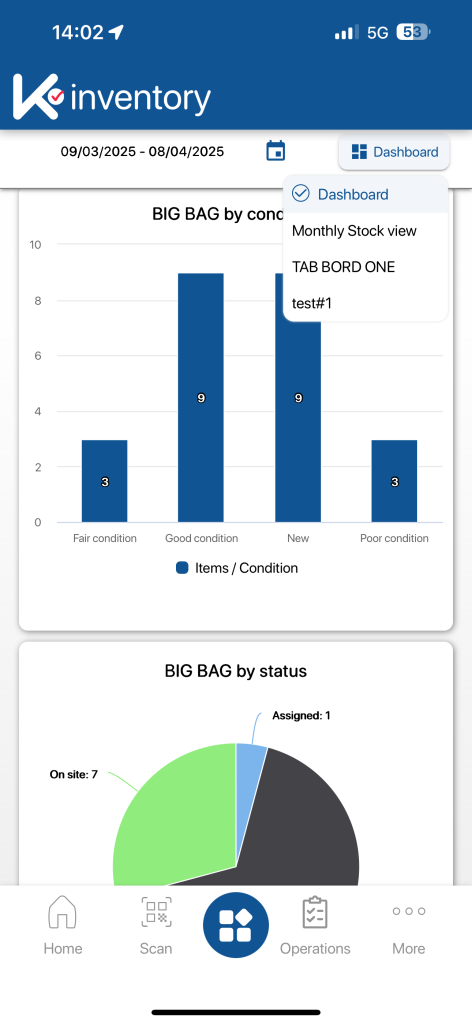
5. To change the dashboard, click on the Dashboard button button, then select a dashboard from the drop-down list
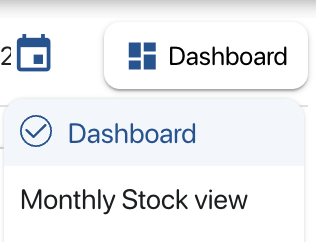
List of available dashboards
- Web
-
1. Click on the Reports

Dashboard page
2. To change the monitoring period, click on the Calendar icon
 icon, then select the desired time interval
Pop-up to select monitoring period
3. To hide a graph in a dashboard, click on the icon more actions
 icon, then on the Hide button to hide a Dashboard
4. To download a customized graph, click on the icon more actions
icon, then on the Download A copy of the graphic will be downloaded in png format.Downloaded chart
5. To change the dashboard, click on the Dashboard button button, then select a dashboard from the drop-down list
List of available dashboards
- Mobile
-
To continue browsing, here are a few articles related to this page: